How to Spot a Tipster's Fake Betting History: Part 2
Posted 24th October 2018
Last year I published an article both on Football-Data and at Pinnacle explaining a method of testing the credibility of a betting history, for example of a tipster who wants you to buy their tips. This was the Wald-Wolfowitz runs test. Over the years, I've also covered numerous aspects of due diligence a punter should undertake when considering purchasing tips, most importantly ensuring the tipster's record has been independently verified, or at the very least can be proven to come from a credible and trustworthy source. I've also discussed testing the betting history's odds against their closing prices: a genuinely skilled tipster should be moving markets. The Wald-Wolfowitz runs test was an example of a statistical procedure one can follow where these other methods of due diligence prove more problematic. In this article, I want to present another method: the binomial standard deviation.
A bet is essentially a binary proposition: it either wins or it doesn't. The simplest of examples would be to bet on the outcome of a coin toss, where the fair odds of heads or tails are 2.00 (with 50% outcome probability). If we want to know what the probabilities of say 3 heads in 5 coin tosses are, or 20 heads in 50 coin tosses, we can use the binomial distribution. Whilst it is actually a discrete distribution, with increasing numbers of coin tosses it starts to look very much like the bell shaped curve of the continuous normal distribution. It shows that we can expect most heads-tails outcomes from a series of coin tosses to be centred close to the expectation of 50-50, with far fewer deviating further away. Those of you who are familiar with my material will know I'm just going over old ground here.
We can measure by how much the distribution of heads/tails counts (or wins/losses in betting) varies using the standard deviation. For the binomial distribution, it has a simple formula:
σ = √(npq)
σ = standard deviation
n = number of trials (for example coin tosses or bets).
p = probability of success (heads or bet won)
q = probability of failure (tails or bet lost)
The standard deviation is the square root of the product of the number of trials, probability of success and probability of failure.
Since q = 1-p, for the simple 50-50 bivalence, p = q and hence the formula reduces to:
σ = p√n
You will notice that for increasing n, the standard deviation, σ, will also increase. For example, for 16 coin tosses, σ = 2, whilst for 64 coin tosses σ = 4. This tells us that about two-thirds of 16-coin-toss samples will have between 6 and 10 heads (or between 37.5% and 62.5% heads), whilst two thirds of 64-coin-toss samples will have between 28 and 36 heads (or between 43.75% and 56.25% heads). Notice how as n has increased the percentage of heads within one standard deviation of the expected 50% has narrowed. Essentially, this is a description of the law of large numbers: the average of the results obtained from a large number of trials should be close to the expected value, and will tend to become closer as more trials are performed.
We can reformulate this analysis by considering the percentage of successes/failures (heads/tails or wins/losses) instead of actual counts. To calculate the percentage of success in a series of trials we should divide their number by the total number of trials, n. Similarly, to calculate the standard deviation in percentages, we must also divide by n. Hence.
σ = √(npq)/n = √(pq)/√n = √(p-p2)/√n
And for the simplest 50-50 bivalence:
σ = p/√n
This time the standard deviation in the percentage of heads in 16-coin-toss samples is 0.125 (or 12.5%), whilst for 64-coin-toss samples is 0.0625 (or 6.25%). This confirms the law of large numbers: as the number of trials increases, the percentage of successes/heads/wins moves closer to the expected value.
So much for the statistics lesson; what can the binary standard deviation do for us with regards the analysis of a betting history? Let's start with the simplest of examples: bets with odds 2.00 and no bookmaker's margin. Consider a population of 10,000 bets. We can imagine that population as being made up of a number of equally-sized samples, for example 100 100-bet samples or 200 50-bet samples or 500 20-bet samples. We know that the expected win percentage for each of those samples is 50%. However, we also know that we won't always get 50% for those samples - the inherent random variability of sports, as in coin tossing, will see to that - and how they will vary will be explained by the binomial distribution.
Consider the 100 100-bet samples. The binomial standard deviation in win percentages for 100 50-50 win-lose propositions is 0.05 (5%), implying about two-thirds will fall between 45% and 55%. Using Excel's random number generator to simulate 10,000 bets with a 50% win probability, I've calculated the percentage wins for each of those 100 samples and calculated the standard deviation. The answer was 0.0493 or 4.93%, pretty close to expectation. Let's repeat this 10,000 times by means of a Monte Carlo simulation. The average of those 10,000 standard deviations was 0.0499 or 4.99%, implying our Monte Carlo confirms the first principles mathematics. [For the record, the standard deviation in those Monte Carlo standard deviations (still with me?) was 0.0035 or 0.35% implying about two-thirds were within 4.64% and 5.34%.]
What if instead the betting odds were 4.00? This time, p = 0.25, and so our theoretical binomial standard deviation in win percentage will be:
√(0.25-0.252)/√100 = 0.0433 or 4.33%.
This implies about two-thirds of our 100-bet samples will show win rates between 20.67% and 29.33%.
Running the same Monte Carlo analysis as before confirms the theory. The average standard deviation in win probability was 4.31% with a standard deviation of 0.31%.
So long as we know p, the win probability of a bet, and all our bets have the same win probability, then we can use the binomial standard deviation to see what range of sample performance we can expect to occur.
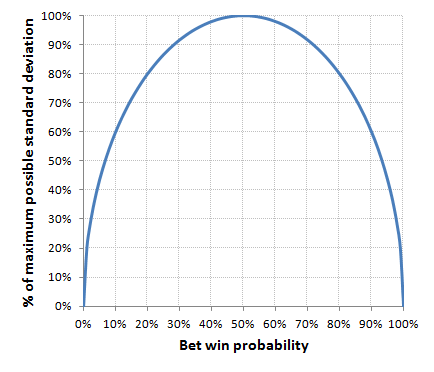
In fact the binomial standard deviation is a maximum at, and symmetrical about, the 50% win probability. So for example, the standard deviation in 100-bet samples where the win probability is 75% (odds of 1.333) is also 4.33%. The chart below illustrates how the standard deviation varies as a percentage of the maximum possible standard deviation for varying win probability, p.
Of course nothing in the real world of betting is as idealised as this. Firstly, no all of our bets will have the same odds or win probabilities. Secondly, not all of our samples will have the same average odds or average win percentages. Let's use Monte Carlo again to see how these might impact on our results.
First let's consider different win probabilities. Using Excel, I generated a series of 100 normally distributed win probabilities with expected average 50% and standard deviation 10%. Whilst this probably doesn't replicate people's real choice of betting odds it was the most convenient way to build a set of odds that showed some kind of meaningful variability. The set of odds generated is shown in the figure below.
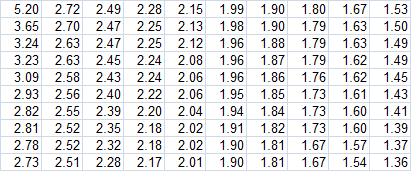
You can see most of them are in the range 1.66 to 2.50 but there are also some outliers too. The average win probability for this generated sample was 0.4998.
Copying this sample 100 times I then built a population of 10,000 bets, where each 100-bet sample was the same, and then repeated the Monte Carlo analysis from before. This time the standard deviation in win percentage for the 100-bet samples was 4.86%, lower than expectation (5%) but only marginally so. Given the range of win probabilities that went into the simulation it's easy to see why. Most of the odds were within 1.66 and 2.50. The respective 100-bet binominal standard deviations for those odds are 0.049. Even for odds of 5.20, the highest in the sample, the expected 100-bet standard deviation is still 0.39. The standard deviation in win percentages doesn't really drop significantly until we reach the extreme long and short odds which most punters are not betting most of the time.
Is there a quicker way to estimate what the 100-bet win percentage standard deviation should be for this kind of betting history? Yes. Simply calculate the expected standard deviation for every win probability in the sample, assuming each was part of a bigger 100-bet sample where each bet has that same win probability, and then calculate their average. Doing this for my 10,000 bet population I arrive at a figure of 0.0488 or 4.88%, almost exactly the same as the figure produced by the Monte Carlo method.
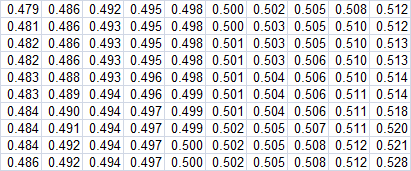
Now what happens if not all our 100-bet samples have the same average win probability? Taking the population of 10,000 bets I jumbled them up randomly so each sample of 100 bets didn't have quite the same average. The set of 100 averages is shown in the figure below.
Running exactly the same Monte Carlo simulation again produced a standard deviation in 100-bet win percentages of 0.0496 or 4.96%. The impact of the variable 100-bet average win probabilities has been to increase the standard deviation in win percentages by roughly the same amount as it was decreased by the variable intra-sample odds.
All this Monte Carlo analysis is a rather long winded way of saying that provided you break a betting history into equal-sized samples, provided the range of odds is not extreme, and provided your inter-sample average win percentages don't vary too much (they shouldn't if the pick selection methodology doesn't change dramatically and the sample sizes are reasonable - 50 and perhaps even 25 should be adequate), then the binomial standard deviation formula will provide a pretty robust method of estimating what it should be for a real world betting history.
So now to test it. I dug out some old betting records I have, 4 from my days verifying tipsters as part of the Sports-Tipsters project and 4 from Pyckio which I'd kept from the analysis for my last book. To keep things as simple as possible, I considered only tipsters that mostly advised 50-50 bet propositions with fair odds close to 2.00. Furthermore, I removed all Asian handicap half wins, half losses, pushes and voids, leaving just straight wins and losses. Provided the remaining bets are left in the sequence they were issued, this removal should have no influence. Consecutive bets, after all, should be completely independent of their previous ones, unless you wish to sign up to the gambler's fallacy. All of the remaining records were at least 1,000 bets in size, allowing me to create meaningful 100-bet samples for each tipster.
The figure below compares the expected binomial standard deviation in 100-bet win percentages with the standard deviation actually observed. To calculate the expected value, for each tipster it was assumed that the average win probability was equivalent to their strike rate. In other words, if they won 50% of their bets, then their expected average win probability is 50%; if 55%, then 55% and so on.
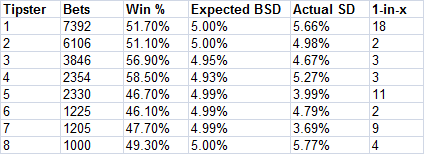
For the most part, the actual standard deviation in the 100-bet sample win percentages are not a million miles away from those predicted by the simple binomial standard distribution formula. The 1-in-x column shows the results of a Monte Carlon simulation estimating the probability that such deviations from expectation would happen by chance. "Nothing statistically significant to see here, M'lud."
Now let's take a look at one of the tipsters "verified" by the self proclaimed sports monitor WagerPolice.com. I've previously written about WagerPolice in March 2014 in an article appropriately named Suckers and Sharks. They still have the same disclaimer on their website as they did then. Let me reiterate it:
WagerPolice is a completely independent sports monitor service. Our goal is to provide a service built on trust and integrity, for both our clients and the betting public, while also helping bring success to our clients by driving bettors to their sports handicapping services. We are not associated with any other sports handicapping services.
I won't go over again why I consider this all to be complete bullshit, you can read the original article. Here, I want to use the binomial standard deviation formula on one of their verified services: HighRollers. Being a handicapping service, like most US sports picks services are, the vast majority of their picks have similar odds, and hence similar win probabilities. A third of them had exactly the same price of -110, or 1.909 in decimal notation, with three-quarters between 1.8 and 2.2.
From a collected sample of 2,666 picks (with voids and pushes removed), the win percentage was 65.9%. Most of you will know by now that I consider this sort of published handicap win rate to be impossible. A couple of recent articles on Football-Data and Pinnacle will explain more for those interested. However, for those less well versed in probability such a figure doesn't, on the face of it, appear to be completely extraordinary, certainly nothing like the silly figures of 85%, 90% and more quoted by some far eastern scammers. So let's delve into the record.
With a win rate of 65.9% let's do as we did earlier and assume that this means the tipster really is that good and give him an average win probability for their bets of 65.9%. Taking 0.659 as the value of p in our binomial standard deviation formula gives us an expected 100-bet win percentage standard deviation of 4.74%. This means that about two-thirds of 100-bets samples should have win percentages between roughly 61% and 71% and about 95% of them between 56% and 75%.
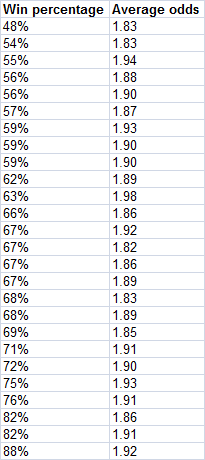
In fact just 10 of the 26 possible 100-bet samples had win percentage within 1 standard deviation, above or below expectation. The lowest was 48% whilst the highest was 88%. They are all shown below along with the average odds for each sample.
So what was the actual standard deviation in these 26 100-bet samples win percentages? In fact it was a massive 9.59%, double what would be predicted by the binomial formula. Given what we learnt about the impact on the standard deviation of varying odds, it's difficult to believe the fairly narrow variation in this 26-sample set had much to do with this. Besides, the varying odds within each sample would counteract that influence. Compared to the set of 8 tipsters I showed earlier and which I know to be genuine and honest records, this is an outlier of significant proportions. How significant? Well, if we run a 10,000-iteration Monte Carlo simulation with an expected binomial standard deviation of 4.74% on 26 100-bet samples, we find a standard deviation in the standard deviations of 0.67%. Hence, HighRollers' actual standard deviation in win percentages is over 7 standard deviations away from expectation. In old money that has roughly a 1 in a trillion probability of happening by chance. Not 1-in-3, or 1-in-9 or 1-in-18. 1-in-1,000,000,000,000!!!
Removing all prices shorter than 1.909 and longer than 2.10 in an attempt to eliminate some of the potential problems with an excessively variable set of odds left 1,367 picks with a win percentage of 66.9%. The expected binomial standard deviation in 100-bet samples is thus 4.70%. The actual win percentage standard deviation in the 13 100-bet samples available here is 9.16%. A 10,000-iteration produced a standard deviation in the standard deviations of 0.94%, meaning observation was 4.7 standard deviations away from expectation, or about 1 in a million in old money.
There is simply too much variation in HighRollers' inter-sample win probability for this to have conceivably happened by chance. Way too much. The single win percentages of 48% and 88% should not happen in 26 100-bet samples. For a tipster capable of winning 66% of his bets where those bets are of a very similar nature (i.e. win probability), hitting 88% in a single 100-bet sample should happen only once in about a million samples.
Choosing different samples sizes yields the same conclusions. For 50 bet samples, expected binomial standard deviation is 6.7%, actual is 11.0%. For 25-bet samples, expected is 9.5%, actual is 13.6%. For 200-bet samples, expected is 3.4%, actual is 8.7%. However you cut this, this record shouldn't happen, even if the tipster is genuinely capable of winning 66% of his 50-50 propositions. The conclusion? HighRollers, or should I say WagerPolice, who manage all these fake services, made it all up - badly.
If something is too good to be true, it almost always is. This method of using the binomial standard deviation is a neat little trick to help you prove it, and silence those bullshitters who try to trick you. As with the Wald-Wolfowitz runs test, this method is able to expose charlatans who too easily get fooled by randomness when attempting to create their tissue of lies. Just as the Wald-Wolfowitz runs test catches out people who can't properly tell what a random sequence of wins and losses looks like (it's easily done, even by people who think they get probability - see my original article), the binomial standard deviation test will catch out those who either overestimate or underestimate how much variation their win-loss record should show when attempting to make one up.
|