The Favourite-Longshot Bias Revisited
Posted 30th November 2015
The following material is adapted from my forthcoming book Squares & Sharps, Suckers & Sharks: The Science, Psychology and Philosophy of Gambling.
The overbetting of low probability outcomes in sports and racing has been a well observed and frequently studied phenomenon for many decades, and something I've discussed in previous betting articles (see: Market Inefficiency and the Favourite–Longshot Bias and Evidence for the Favourite–Longshot Bias in Football Betting Odds). In this article I will revisit this apparent market inefficiency to investigate what might account for its existence.
In a typical betting market, the odds quoted by a bookmaker provide a measure of the implied probabilities of all the possible outcomes. They add up to more than 100%, and the amount by which they do, known as the overround, provides a measure of the profit margin the bookmaker typically expects to make. For example, if the 'true' odds for a 50-50 proposition are 2.00 for each side, he might offer them at 1.90, implying a probability of 52.6% and an overround of 105.3% (or margin of 5.3%, or 0.053 expressed as a decimal). In such an example, his advantage is spread evenly across both sides of the proposition.
What happens in cases where one side is a heavy favourite? Consider, for example, a market where the true odds were 1.25 (implying a probability of 80%) and 5.00 (implying a probability of 20%). If the bookmaker spreads a 5% margin equally across these two propositions he'll be offering odds of 1.19 and 4.76 respectively. That, however, is not what happens. On the contrary he'll more usually offer something like 1.21 and 4.44. The favourite has only been shortened by about 3% whilst the underdog or longshot has been shortened by about 12%. This disproportionate application of the bookmaker's profit margin gives rise to what is called the favourite–longshot bias.
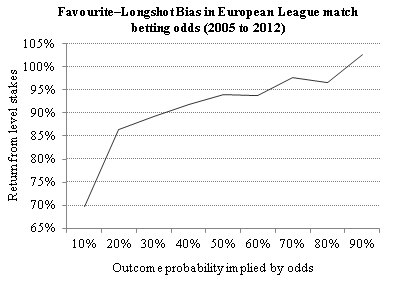
Given this bias in betting odds, sports bettors should experience poorer percentage returns betting randomly on longshots than they will from favourites. That, in fact, is exactly what happens. Whilst the bookmakers won't provide profits data broken down according to betting price, we can infer what is happening by comparing odds to their actual outcomes. In my previous article Evidence for the Favourite–Longshot Bias in Football Betting Odds, for example, I reported blind betting returns for domestic European football league fixed odds for matches played between 2005 and 2012. Those results are summarised graphically below.

Returns from randomly betting football match odds shorter than about 1.50 (or greater than 66% outcome probability) are close to break-even. By contrast, randomly betting prices longer than 5.00 (or less than 20% outcome probability) can be 80% or lower. Similar examples of the favourite-longshot bias in horse racing, tennis, basketball, darts and snooker betting markets were repored in my last book How to Find a Black Cat in a Coal Cellar: the Truth about Sports Tipsters.
The longer the odds you are betting the poorer the theoretical returns (from betting blindly), because the greater the margin that has been applied by the bookmaker. The really interesting question is why does this happen? The favourite–longshot bias has been a source of fascination for academics for a long time. Numerous explanations for its existence have been proposed, including demand-side (risk-seeking) utility preferences of bettors, supply-side responses to insider information (more usually associated with longshots) and even an expression of the gambler's fallacy. Players, teams and runners who have lost many times in succession tend to be longshots, and thus a gambler's fallacious belief that they are due for a win may contribute to their overbetting. Probably many of thesee explanations are working together but the one that perhaps seems most compelling is that offered by prospect theory and specifically the misjudgement or misperception of probabilities as predicted by the possibility and certainty effects and bettors insensitivity to changes in probability. Numerous research papers have now concluded that bettors express risk-seeking utility towards longshots (the possibility effect) whilst expressing risk aversion towards favourites (the certainty effect), and that the non-linear probability weights that they apply in formulating these specific utility preferences arise from misperceptions of the probabilities involved.
In his book, Thinking Fast and Slow, Daniel Kahneman invites us to consider how we might feel about having the chances of receiving $1 million improved by 5%.
- From 0% to 5%
- From 5% to 10%
- From 60% to 65%
- From 95% to 100%
Evidently, the news for each case is not equivalent. Consider the 4th case. Learning that we are certain to become millionaires is fantastic news indeed. The jump from 95% to 100% in terms of attractiveness of the prospect is significant. Consider this from the point of view of a gamble. How much would you be prepared to pay to increase the probability of winning from 95% to 100%, to thereby guarantee a certainty and avoid the small chance of failure? The theory of expected value would suggest $50,000 to be a fair price, and no more. But suppose that sum was refused, and you were asked for $100,000. Would you pay? Almost certainly you would. Essentially, outcomes that are nearly (but not quite) certain are given less weight, compared to absolute certainty, than their probability justifies. In such an example, to avoid the fear of disappointment we are risk averse and accept a settlement with negative value expectation. Kahneman describes this phenomenon as the 'certainty effect.'
At the other end of the probability scale we encounter the 'possibility effect.' The change from a 5% chance to a 10% chance of winning $1 million involves a doubling of expected value, but evidently not expected utility. In contrast, the same absolute percentage increase from 0% to 5% transforms something that was previously impossible into something that has a possibility. No one will buy a lottery ticket if there is no chance of winning, but introduce a tiny possibility of a jackpot and millions will flock to take part, even under conditions of extreme negative expectation.
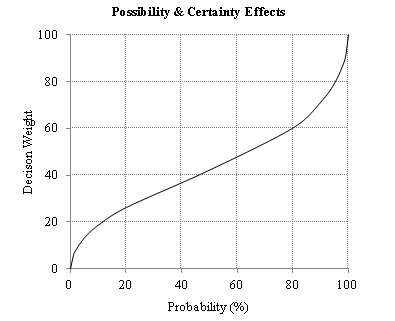
The certainty and possibility effects mean that we don't weight probabilities of outcome exactly according to their numerical values. Improbable outcomes (in betting, longshots) are over-weighted – the possibility effect – whilst near-certain outcomes (the favourites) are underweighted – the certainty effect. Daniel Kahneman and his colleague Amos Tversky attempted to measure these decision weights in the context of gambles for modest monetary value. The chart below provides an illustration for the data which they collected. Between the extremes of possibility and near-certainty is a demonstrable insensitivity to intermediate probabilities. Between outcome probabilities of about 10% and 90%, people's range of decision weights is about two-thirds of what would be predicted by rational decision theory, and between 20% and 80% it's barely half. It is this insensitivity and non-linear weighting of probabilities that has been exploited by market setters in the domain of sports betting and horse racing in the form of the favourite-longshot bias.

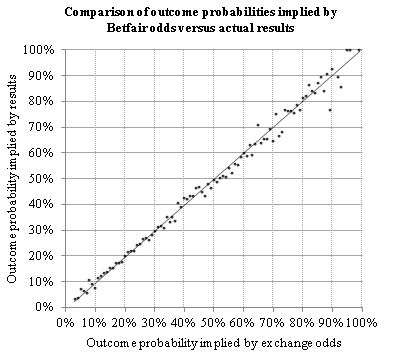
One significant question remains, however: why do betting exchanges largely fail to show evidence of the favourite–longshot bias? As the chart below illustrates (data from 52,411 Betfair odds from worldwide football league matches during the period 29th October 2004 to 31st October 2005), quoted prices closely reflect the 'true' probabilities as inferred from retrospective analysis of results.

In attempting to find answers to this question, David McDonald and colleagues from the Centre for Risk Research at the University of Southampton considered their differences with traditional bookmakers. Whilst bookmakers set the odds, must manage risks and therefore have higher operating costs, at exchanges odds are set by the players themselves, there is no risk management and hence operating costs are minimal. Naturally, the higher operating costs for bookmakers result in less competitive pricing; but why more significantly so for longshots? Indeed, prices offered by exchanges and bookmakers alike (even the least generous bookmakers) are largely the same for the shortest-priced favourites. Given the superior prices for longshots available at the exchanges, explanations for bookmaker favourite–longshot bias that have relied on insider or informed traders knowing more than the bookmaker can surely be discounted. Moreover, in an attempt to manage the liabilities, bookmakers can and do refuse business from 'smart' players. Instead, McDonald has proposed that a bookmaker's optimal policy will be to impose a favourite–longshot bias in their prices to reflect biased preferences of bettors as predicted by certainty and possibility effects previously described.
Essentially, in the same way that bookmakers might be manipulating point spreads in American sports to exploit bettor irrationality (see previous article Favourites Bias in American Point Spreads), McDonald is suggesting that bookmakers manipulate fixed odds for the purposes of risk management simply because they can. Since the customers are less sensitive to changes in lower probabilities, bookmakers can exploit these non-rational utility preferences without anyone much caring or noticing. We can actually see how sensitive or elastic bettors' price demand is by comparing average and best market betting odds that are available to them. The chart below illustrates how the odds tolerance ratio varies with the 'true' probability of outcome for football match betting, based on 50,000 domestic European league games played between July 2005 and March 2012. The best market odds are assumed to provide a reasonable measure of the true outcome probability, whilst the odds tolerance ratio is simply the 'true' probability divided by the probability implied by the average betting odds. For example, if maximum and average betting odds were 2.00 and 1.90 respectively, the 'true' probability would be 50% and the odds tolerance ratio 0.95.

Quite clearly, as the chance of a result falls, bettors' demand for a good price falls too. For example, when best market odds are 1.10 (implied probability 91%), the average is only marginally shorter at 1.07 (93%), giving an odds tolerance ratio of 0.97. By contrast, for best odds of 30 (3.33%), the average price is typically about 20 (5%) and the odds tolerance ratio is far lower (0.67). Evidently, the longer the odds, the more a bookmaker can shorten them without his customers knowing or caring. If correct, such a hypothesis would mean that favourite–longshot bias would be largely a supply side phenomenon. Rather than bookmakers passively responding to the demand preferences of their customers, McDonald is arguing that bookmakers are in fact encouraging their customers to act irrationally simply because they know they will.
|


