The Pitfalls of using Kelly Staking in Sports Betting
Most aspiring bettors will have heard of something called the Kelly Criterion, named after the Bell Labs researcher John Larry Kelly Junior who first described it, as a means of maximising the rate of bankroll growth. However, whilst they may understand the simple formula behind Kelly staking, the majority will be unaware of the pitfalls of using it. In this article, I'd like to explore that material.
A quick recap: Kelly staking is a type of proportional or percentage staking methodology, whereby a certain percentage of you bankroll is staked on your next bet. This means that as your bankroll increases, the absolute size of your stakes will increase too; as it decreases, likewise with your stakes. Kelly introduces two factors for the percentage calculation: the odds and your expected value, or mathematical advantage you believe you hold over the bookmaker's odds. For example, if the published odds are 2.2, but you believe the true figure should be 2.00, then your expected value is given by 2.2/2 – 1 = 0.1 = 10%. In this example, your Kelly stake would then be calculated by dividing the expected value by the decimal odds minus 1, or 0.1/1.2 = 8.33%. If your current bankroll was £150, the advised Kelly stake would be £12.50.
Of course, we know that not every bet wins. Indeed, in a sample of bets there are potentially a very large number of path histories of winning and losing. For bets where all the odds are the same, the mathematics of this can be described by the binomial distribution. Where the odds vary, the normal distribution will offer a useful approximation. However, I'm not going to delve the maths of these here. Instead, I'm going to show you what the range of possible outcomes looks like graphically.
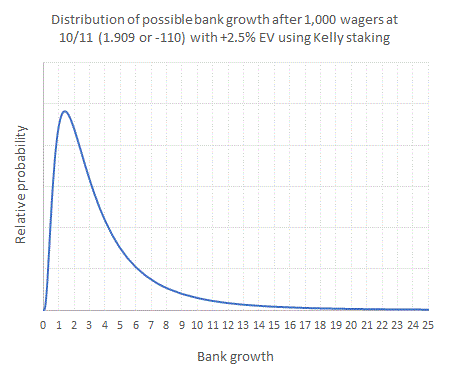
Let's consider an example: a series of 1,000 wagers point spread wagers, each with odds of -110 (US format), or 10/11 and 1.909 in fractional and decimal notation respectively, and where the bettor holds a 2.5% expected value for each bet. Such an advantage at these odds would imply a Kelly stake percentage of 2.75%. If we are correct about our expected value for these bets, we should have increased our bankroll, but good and bad luck will influence exactly what will happen. The range of all possibility outcomes is shown in the first chart below.

Anything greater than 1 implies our bank has grown and we've made a profit. Anything less means our bank has shrunk and we've made a loss. The height of any point on the blue curve gives a measure of the relative likelihood of seeing such a bank growth; the high point represents the most likely bank growth. In this example it is around 1.41; in other words, a 41% increase on what we started with. The total area under the blue curve is equivalent to all (100%) of the possible bank growths. The most striking thing to notice from this chart is its asymmetry, with a steep left-hand side and a very elongated right-hand side. Indeed, some possible outcomes can see bank growth much higher than a factor of 25, although of course these are rare and a consequence of fabulous luck. The reason for the asymmetry is the because the percentage staking applies a power factor to the increase (or decrease) of bankroll size. It's effectively like compound interest. The take-home message, however, is the huge range of possible outcomes, simply governed by good and bad luck. The range is much greater than that for flat staking, where we would apply the same absolute stake size for every sequential bet, regardless of previous winning or losing.
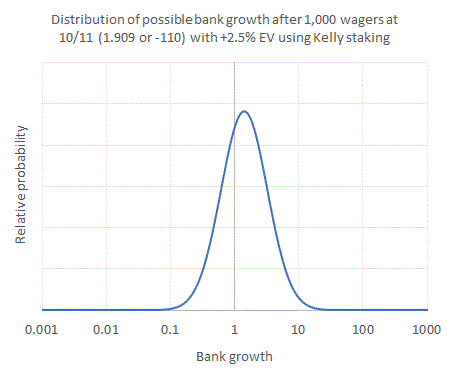
Some betting scenarios will have even bigger asymmetries with enormous right-hand tails, which become visually impossible to interpret. However, because the changes in bankroll size follow a power rule, we can apply a neat little trick to the chart that helps rescale what we are seeing: make the horizontal (bank growth) axis logarithmic.

What we now see is a visually simpler symmetrical distribution of possible bank growth. This shape is called a log-normal distribution. Again, I won't bore you with the mathematics. One useful consequence of displaying a logarithmic chart is that it's visually much easier to assess the probability of making a loss versus making a profit. The area under the curve to the left of the vertical axis line at bank growth = 1 as a fraction of the total area under the curve gives us a measure of the likelihood of ending with less than we had started with. The area to the right, the likelihood of ending with more. In this example the relative probabilities are about 34% and 66%.
To a novice this might sound like quite a high probability of failure. Indeed, arguably it is. If instead I'd been staking the same absolute stake size rather the same percentage, my chances of making a loss would only have been about 18%, assuming I was accurate with my expected value calculation. Why the difference? Well, with percentage staking it takes proportionally longer to recover from losses than it does with flat staking, meaning you spend more time in the red, on average. Of course, when you win more than expected because of good luck, you can see some very big profits, but the trade-off is that actually making any kind of profit is less likely, and the range of different possible outcomes is much greater.
There are many in the world of betting who say Kelly staking is too aggressive; yes, you can have some great returns, but the downside risks are too great. The charts above will have hopefully already given you an insight into the nature of this risk, as measured by the range of possible outcomes. It can be further argued that if you get your expected value calculation wrong, Kelly can leave you in a lot of trouble.
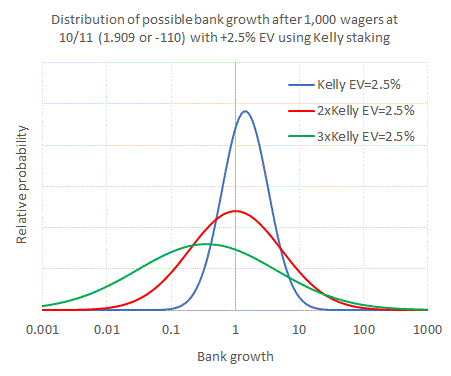
Suppose, in fact, I incorrectly believe my expected value was 5%, when in fact my true expected value is still 2.5%. I would now be betting stakes of 5.5%. How will this change the distribution of possible outcomes? Compare the blue curve (the same as above with stakes of 2.75%) to the red curve below (where stakes are 5.5% but the expected value is still 2.5%).

Two things have changed. Firstly, the width of the distribution has increased. There is a wider range of possible outcomes; the lucky ones make us even richer, but the unlucky ones make us much poorer. Secondly the whole curve has shifted a bit to the left. The most likely outcome is now just about breaking even. 50% of the time we can expect to have increased our bankroll, but that means 50% of the time it will decrease. We've effectively turned an advantage betting system into a coin-tossing machine simply because we'd over-estimated our expected value by a factor of 2. Similarly, the likelihood of doing really badly has increased. Over 8% of the time we'd have shrunk our bankroll by at least 90% (the area under the curve to the left of bank growth = 0.1), compared to less than 0.1% for the blue curve scenario.
If we really mess up and overestimate our expected value by a factor of 3, things get even worse. See the green curve. The distribution of possible outcomes is now even wider and we're now more likely (66%) than not (34%) to make a loss. We've turned wine into piss. OK, you could get lucky see some spectacular bank growth, but do you really want to take the risk, given the massive downside?
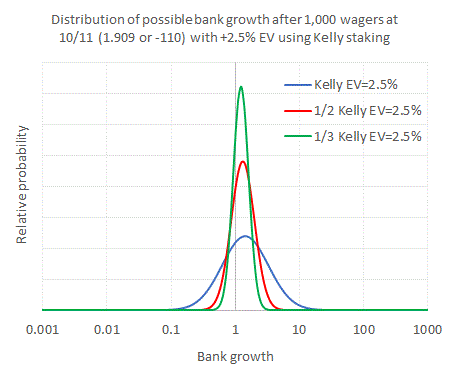
It is precisely for this reason that where bettors do advocate the use of Kelly staking, a fractional factor is applied to the percentage, for example half-Kelly, quarter-Kelly or even eighth-Kelly, thereby hedging against the risk of overestimating your expected value. The next chart compares the original blue curve with 2.75% stakes to those where stakes are half (red) and one third (green) of this figure, again assuming the true expected value is 2.5%. I've reduced the range of the logarithmic horizontal scale for better clarity, but the blue curve is exactly the same as the one in the chart above.

The red and green curves are shifted to the left relative to the blue curves, but the peaks still lie in the profitable region of the chart. Indeed, you could increase the Kelly fraction indefinitely, but they would never fall below bank growth = 1, implying it will always be more likely than not that you'll make a profit. At the same time, the widths of the distributions have reduced, meaning the range of possible outcomes is much narrower and the downside risk lower. For half-Kelly, the chances of seeing some kind of profit have increased from 66% to 73%, whilst your most likely bankroll growth has only dropped from 41% to 29%. With respect to more extreme downsides, a 10% chance of seeing your bank halved has fallen to just 1%; for third-Kelly this is less than 0.1%.
Kelly staking offers a great way to maximise you bankroll growth, but it comes with significant pitfalls. Any kind of percentage staking will dramatically increase the range of possibilities, relative to flat staking, and hence the downside risks if you suffer some poor luck. With Kelly, if you overestimate the advantage that you think you hold over the bookmaker's odds, you can easily turn a winning system into an unprofitable one. I hope this graphical exercise has revealed why. If in doubt, use a fractional Kelly plan and hedge against this potential error. For those interested to pursue this topic further, in my new book Monte Carlo or Bust: Simple Simulations for Aspiring Bettors I have gone into much greater mathematical detail to reveal how these distributions have been calculated and alternatively how they can be estimated with almost no mathematical knowledge at all using a simple simulation method.
|


