Testing your Betting Model
Posted 16th August 2018
Since publishing my last book Squares and Sharps I've talked a lot about the wisdom of the crowd in a betting market. I won't be going over old material about the methodology here, suffice it to say that I have published a consistently profitable betting system which assumes that a collection of punters, specifically Pinnacle sportsbook punters, know best with regards the 'true' odds of a football team winning a match. The full system methodology is documented here.
Neither do I want to review in detail the performance of the system since I started publishing live selections in August 2015, although I will naturally be referring to it during what follows. Readers are free to download full results and see for themselves how it has done. Instead, I want to take this opportunity to investigate how me might test the validity of a betting model, that is to say: is it doing what it is supposed to be doing?
In the three years since first posting Wisdom of the Crowd suggested matches, here are the raw performance figures.
- Picks: 6,562
- Expected Yield: 4.19%
- Actual Yield: 3.79%
- Average Odds: 3.92
We are able to determine what we expect to happen because the nature of the betting system allows us to calculate exactly the expected value of every bet. As a reminder, this is given by the ratio of the odds we bet divided by the fair odds based on the odds published by Pinnacle. We calculate the fair odds by means of a fair odds calculator. In my calculator I offer 4 methods for doing this, three of which consider the favourite-longshot bias. The one I continue to use for this betting system is the 'Margin proportional to odds' method.
These stats clearly show that, as a whole, the betting system has underperformed relative to model expectation. But how significant is this? In absolute terms by 0.449%. But how often might we expect such an under performance? One way we can find out is to run a t-test calculation. I've discussed previously the use of the t-test to test for the statistical significance of a betting record, that is to say how much it differs from blind random guesswork. This time, I want to do the reverse: test for similarity between actual outcome and model expectation.
To perform this in Excel, we can use the following formula:
=TTEST(A:A,B:B,2,3)
This performs a two-sample unequal variance two-tailed t-test. The first sample in column A is expected profits for each bet, simply the expected value as calculated by the betting methodology. So for example if odds bet were 2.10 and fair odds were 2.00, expected value would be 1.05 and expected profit for a unit stake 0.05. In column B we place our actual profits and losses for all bets, showing -1 for a loss and odds - 1 for a win. The '2' for the next term in the formula determines that this will be a two-tailed test, because we don't necessarily know the direction of actual performance relative to expectation, either over or under. Finally the '3' term implies our two samples have unequal variance.
Plugging my figures for the Wisdom of Crowd betting model into this formula yields a p-value of 0.838, that is to say there is an 83.8% probability that my actual results would either be worse than they were or better than 4.19% + 0.449%. In other words, what actually happened was not statistically significantly different to what should have happened (for minimum level statistical significance we would need a p-value of less than 0.05).
I can also perform this calculation using my betting record p-value estimation calculator which uses a simple formula based on actual yield, expected yield, average odds and number of bets. My Excel calculator is preset as a one-tailed because typically we are only interested in testing profits, not losses, but it's easily changed - just change the final '1' in the formula in cell B6 to a '2'. This will have the effect of doubling the outputted p-value. Using this calculator with my figures above yields a p-value of 0.832, almost exactly the same as the first method, confirmation if nothing else that my algorithm on which the calculator is based is valid.
A final method of calculating the p-value can be performed by a Monte Carlo test, where we use a random number generator to simulate game outcomes for all bets and repeat hundreds or thousands of time. For this analysis, I made 10,000 simulations, calculating the final theoretical yield for each. In total there were 4,209 yields lower than 3.79% and 4,144 over 4.19% + 0.449% for a total of 8,353 or 83.5% of all simulations, almost exactly matching the figures from the two t-test calculations before.
When testing your own betting model, you can choose any of these methods, I have simply reviewed all three for comparative purposes.
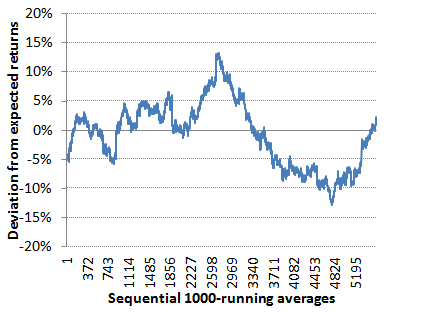
Whilst it might be true to say that the actual performance of my betting system has been close to what should have happened over the full three years, this is certainly not the case over the shorter term. The chart below show how the performance over a 1,000-bet running average evolved after the first 1,000 bets through to the end as a function of the magnitude of the deviation from expectation. Much of the first half was characterised by over performance whilst the second half saw more under performance, with a recovery towards the end. Superimposed on this was much shorter time scale variation. It is an illustration of quite how much influence randomness plays on the evolution of a betting system performance and bankroll, something I've discussed previously on Pinnacle's Betting Resources.
How unlikely were some of these over and under performances? Using my t-test calculator in the same way as before, I calculated the p-value for each of these 1,000-bet running averages, and then inverted them to turn them into 1-in-x values, that is to say we would expect such an under or over performance during 1,000 bets once in x occasions. [I would like to acknowledge Christian Baier's own Wisdom of Crowd betting system that helped be crystallise the idea of running this kind of analysis.] The values are plotted in the second chart below, alongside the original percentage performance deviations. For the most part, the running averages 1-in-x figures remain low, implying actual performances remain close to expectation. But there are spikes now and again, and two in particular with values of over 60 and 40 respectively, the first representing an over performance, the second an under performance.
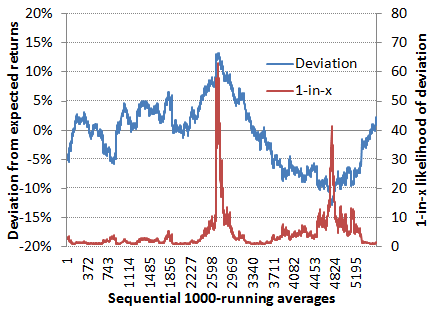
At a significance level of 0.05 (1-in-20) both of these spikes could be considered statistically significant, that is to say something other than chance, for example model failure, might be accounting for them. But evidently on both occasions actual performance regressed back towards expectation. Thus, in hindsight, could one really draw the conclusion that the betting model was failing during these periods? This question illustrates a fundamental problem with this type of statistical testing: it can never actual confirm whether chance isn't the only explanation for something happening, just a probability that it is.
Hindsight is a wonderful thing. In contrast, how would we have felt in real time as these deviations played out? During the first, inevitably, we wouldn't have cared. Why complain if we're making more profit than we should? Why question the validity of our model? And yet that is precisely what we should be doing, as undoubtedly we would when faced with the 1-in-40 under performance that followed a year or so later. As Daniel Kahneman has explained, losses hurt more than gains are enjoyed. We're far more likely to start doubting our model when it's performing badly than when it's performing too well. In fact, we should always be questioning our model, always doubting its validity. Presenting its over and under performance in a time series manner such as this can hopefully help us in that task.
|