A Profitable Betting System? Exploiting the Hot Hand Fallacy
Posted 20th November 2018
In 2016 I published my book Squares & Sharps, Suckers & Sharks: Science, Psychology & Philosophy of Gambling in which I described a potentially profitable betting system that adopted a so-called contrarian approach (betting against the market). Testing it retrospectively over the period 2005/06 to 2014/15 on European football league matches could have returned a profit over turnover of 4% to best market prices although staking limits and other bookmaker restrictions would have had an influence on achieving this return.
I also made the methodology available via a paid PDF document. Today I have decided to waive the fee and make it freely available, although naturally I would hope that those of you who haven't already done so would prefer to still buy and read my book which has a whole lot more information besides.
The idea behind this contrarian approach lies in exploiting a cognitive bias known as the hot hand fallacy, in which people wrongly believe in the existence of hot streaks or winning streaks. The hot hand fallacy was first coined by Amos Tversky and colleagues in their 1985 paper The Hot Hand in Basketball, in which they showed a person's sense of hot streaks was attributed to a general misconception of chance. In expressing such a fallacy, the influence of regression to the mean (the tendency for a variable to be closer to the average on a subsequent measurement following a previous extreme one) will be ignored.
I don't want to go over too much of the same material that I have published before. Readers can buy my book or download my Contrarian Betting System PDF. I have also published an article about the methodology at Pinnacle's Betting Resources. For now it is sufficient to briefly review how the methodology works.
To get a measure of how hot (winning) or cold (losing) a football team actually is, I constructed an odds-adjusted scoring system that awarded a score of 1 - 1/odds to a team who wins a match and a score of -1/odds to a team that fails to win a match. The odds here are based on Pinnacle closing prices with the margin removed (via my logarithmic function method) Thus, scores take into account the likelihood of a team winning a match as determined by their odds. This also means we don't have to worry about the distinction between home and away. The less/more likely a win, the bigger/smaller a score is awarded in the event of a win. The converse is true where teams fail to win. Scores are additive across a number of games. Being odds-adjusted the long term expectation for teams will be to have scores of zero. Over the shorter term however, for example 6 games, hot streaks will reveals themselves with positive scores, whilst cold streaks will have negative scores.
Teams ratings are calculated by adding up team scores for a number of previous matches. In my original work for the book and PDF I simply decided to calculate cumulative ratings as the season progressed. For example a team playing their 4th match would have a team rating calculated by adding up their score for the first 3 matches; their rating for the 13th match would be based on their scores for the first 12; and so on. For my Pinnacle article, and the data analysis which follows here, I decided to use a 'last-6-matches' rating. These were purely arbitrary choices. If you wish to replicate what I have done, you're welcome to test other recent match numbers.
To construct a match rating, we simply subtract one team rating away from another to arrive at a relative heat difference between two teams. It doesn't matter which way round you do this, since the rating will be equal and opposite if you choose the alternative way round. The important point is this: we are only interested in backing the relatively colder of the two teams? Why? The idea, as discussed in my previous work on this methodology, is that punters will over bet relatively hotter teams, mistakenly believing that they have a better chance of winning than they otherwise would, simply by virtue of the fact that they are on a relatively better winning streak than their opposition. When teams are over bet that implies their odds will be shorter than a 'true' probability of them winning would imply. Conversely, their relatively colder opposition will be under bet, and hence have longer odds than they should. Hence, there is the potential for expected value.
There are two questions that need answering. Firstly, does such a bias reveal itself in real data? Secondly, if it does is it strong enough to offer a profit after the bookmaker's margin has been taken into account? My original work on this analysed European football league data from my main leagues database (22 divisions from 11 nations) and revealed a weak but statistically significant profitable opportunity. For my new article here, I decided to analyse my extra leagues data (16 more European and worldwide divisions).
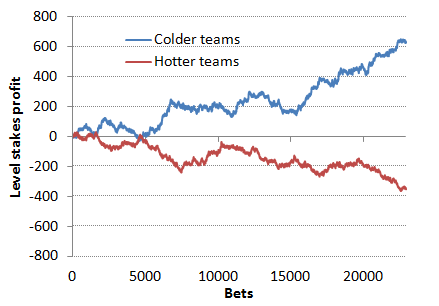
From a total of 28,386 matches there were 22,873 total possible match ratings from 45,746 'last-6-match' team ratings. Subtracting the smaller team rating from the bigger team rating, these positive match ratings ranged from 0 to +6.30. Naturally, subtracting the other way round (bigger from smaller) produced a mirror image sample of negative match ratings ranging from 0 to -6.30. The chart below compares the theoretical profit histories (ordered by date) of these two samples. The blue line shows the performance one would have had backing all the relatively colder teams; the red line shows the performance backing the relatively hotter teams.

The superior performance of the relatively colder teams versus the relatively hotter teams is striking and replicates my previous data analyses. The difference between the two is statistically significant (p-value 0.002 from a two sample, 1-tailed t-test). The level stakes return on investment backing all 22,873 relatively colder teams to 'fair' odds was 102.75%, against 98.45% backing all relatively hotter teams.
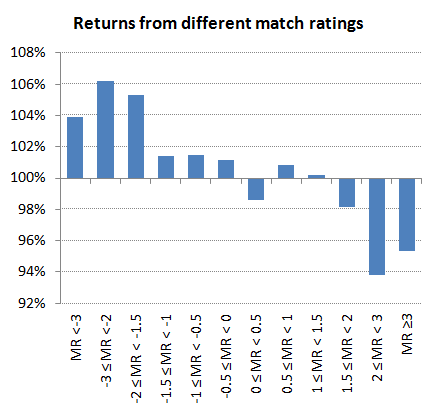
As for my Pinnacle article, I decided to categorise matches by rating bands and compare theoretical level stakes returns to 'fair' odds. These are shown in the next chart.

As reported at Pinnacle, the relatively more cold a team is, the greater the theoretical value available.
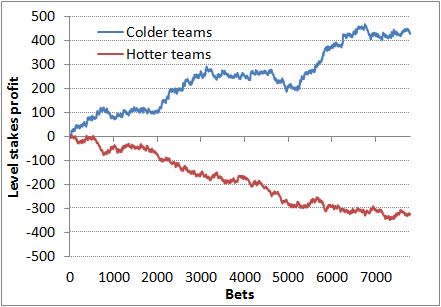
The final chart compares performances for only those match ratings less than -1.5 and greater than +1.5, again to 'fair' odds. Their theoretical returns on investment from 7,795 possible bets were 105.48% and 95.83% respectively, the difference being highly statistically significant (p-value = 0.00009).

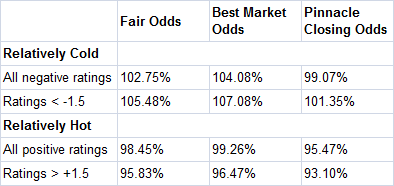
The table below compares all 'cold' versus 'hot' teams performance and the narrower sample of <-1.5 versus >1.5 match ratings performance for 'fair' closing odds, best market closing odds and Pinnacle closing odds. Considerably better performance is possible using best market prices. Of course, best in market typically means a recreational or soft bookmaker, and they may restrict your activity with them if they suspect you are capable of finding expected value in their betting odds unless you take additional measures to disguise your activity.

The fact that the 'coldest' teams still offer a profit from Pinnacle's closing prices is interesting. It tells us that our fair odds, constructed as they were from Pinnacle's closing prices, are probably not quite fair. Perhaps that partly explains the slight relative asymmetry between 'hot' and 'cold' teams measured against break even (ROI = 100%), with 'cold' teams performing relatively slightly better than 'hot' teams performed badly. More generally, then, this informs us that there resides an underlying market efficiency in Pinnacle's closing odds arising from punters expressing the hot hand fallacy in their patterns of betting. The difference between 'hot' and 'cold' teams performance to Pinnacle's closing prices is still significant (p-value = 0.006 for all ratings, 0.0004 for ratings <-1.5 versus >1.5). The size of Pinnacle's margin (about 3% typically for this sample) is sufficient to offer protection against a blanket betting of all 'cold' teams, but a profit over turnover of 1.35% was still achievable betting all teams with a match rating at least 1.5 lower than their opposition.
To many this might not sound like much of a return. Indeed, to exploit it consistently would take nerves of steel and patience to ride out the inevitable periods of stagnation and loss taking. However, what makes this performance particularly intriguing is that it didn't rely on any match forecasting per se, merely the use of psychology to understand and exploit a bias in the way the herd typically bet on football teams. Whilst only small, the 1.35% profit from 7,795 bets (average odds 3.76) could only be bettered 5 times in 1,000 Monte Carlo iterations when randomly selecting 7,795 picks from a population of 45,746 possible teams.
Of course, when wondering whether we've really stumbled on a real and meaningful betting system, we should always remind ourselves that past performance does not guarantee future success. There is always the possibility that what you think you might have found is nothing but luck. p-values, lest you need reminding, do not tell us the probability that something is real, they merely tell us the chances of something happening should nothing real underlie it. Furthermore, where you may have found something real and profitable (and more than just luck), future exploitation of such a system can see its advantage disappear. That, however, is the nature of betting: you will always have to work hard to stay one step ahead of the rest.
|


