Steamers and Drifters Revisited: Evidence for Closing Market Efficiency?
Posted 20th September 2018
Following the theme of revisiting earlier articles, I was promoted by a tweet from Christian Baier (follow him if you aspire to be an informed punter) about the possibility of inefficiency in a betting market. Specifically he was referring to something I wrote a couple of years ago on steaming and drifting in a football match betting market which I had taken from my second book The Truth about Sports Tipsters. Here I had analysed some English football betting odds to show that prices which shorten (steam) do not shorten enough, whilst prices which lengthen (drift) do not lengthen enough by closing. This would imply that the market is not fully efficient, that is to say reflect the 'true' probabilities of game outcomes as defined retrospectively by their results.
Admittedly there were some caveats to the analysis, not least the fact that the pre-closing and closing prices (market averages) came from different odds comparisons (Betbrain for pre-closing and Oddsportal for closing). Nevertheless, I made a reasonable case that such a problem was only minor. Moreover, the level of statistical significance between the level stakes profitability for steamers versus drifters was very convincing, even though the sample size was arguably on the small side (30,540 betting odds). So when Christian reminded me of this piece of analysis it occurred to me that I now had a much bigger dataset of Pinnacle betting odds that I could analyse to repeat the investigation.
The sample in question is one I've used before for other analyses looking at the efficiency of Pinnacle betting odds and comes from Indatabet. Matches included ranged from August 2007 to July 2017. After cleaning the data for obvious and possible errors and matches that went beyond 90 minutes or were awarded, I was left with a sample of 158,092 matches and 474,276 home-draw-away opening and closing betting odds pairs.
I chose to measure steaming and drifting in the same way by simply calculating the ratio of the opening to closing price to provide a measure of the movement. For example, if a price opened at 2.5 and closed at 2.0, the movement was 1.25 or 25%. Of course, if a price opens at 2.0 and closes at 2.5, the movement is 20%, a different figure for the same change in result probability. In the original article I circumnavigated this problem by just reversing the ratio, i.e. for drifters I used the ratio of closing to openings odds. This time in an attempt to be a bit more mathematically rigorous, I've calculated the natural logarithm (Ln) of the ratio. So for these two examples, the figures would be Ln(2.5/2.0) and Ln(2.0/2.5) = +0.223 and -0.223. Hence equivalent streaming and drifting will be symmetrically equal and opposite, centred around zero for prices which don't move at all.
The chart below shows how the theoretical level stakes returns vary with the logarithm of the opening to closing price ratio, for both opening and closing prices. The figure is almost identical to the two I published in my Pinnacle article investigating the efficiency of their odds, which proved that the ratio of opening to closing price is a very useful predictor of expected value and returns, and by extension that on average closing prices are reasonably efficient. This is hardly surprising because this dataset is just a slightly larger version of the one I used for my Pinnacle article. Both trend lines cross the origin where the x-axis = 0 (implying no price movement between opening and closing) at around -3%, which is pretty close to Pinnacle's typical margin for this sample of data.
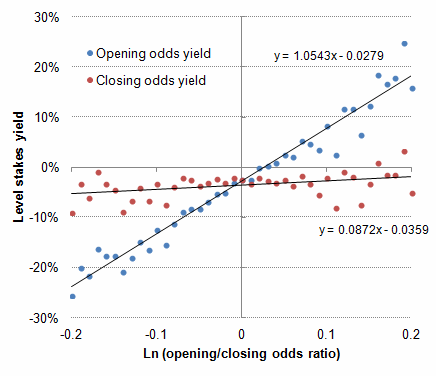
At the time I didn't think too much about the implications of the weak but non-zero gradient in the closing odds trend line. If closing odds are perfectly efficient, this slope should be zero. But it isn't, and it slopes in the direction that supports the idea that even by closing, steamers have not sufficiently steamed, and drifters haven't sufficiently drifted. I never drew a similar chart for my original steamers and drifters article (preferring instead to categorise the data in a table), largely because the much smaller sample meant that the variances were greater. Anyway, here it is now.
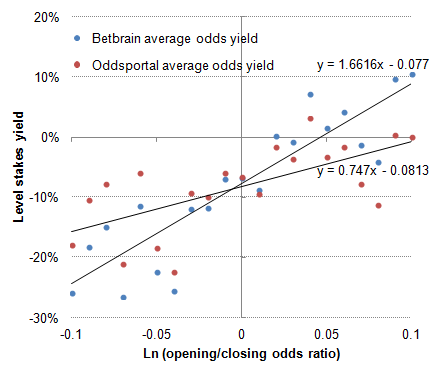 Three observations are noteworthy. Firstly, as already suggested, the variance around the trend lines is much greater. This is simply a consequence of the sample being much smaller. Secondly, they trend lines cross the y-axis (x = o) at around -7 to -8%. Again, this is explained by the different margins, which were indeed around 7% for market average prices. Finally, the gradient of the Oddsportal (closing) prices trend line is much steeper, implying that this sample of closing prices was not fully efficient (with steamers not fully steamed and drifters not fully drifted). No wonder the difference in closing price returns for steamers and drifters was hugely significant (p-value = 0.0002). Recall that for the 597 prices in my original English football match betting sample that steamed by more than 10%, one would have made a 7.5% profit over turnover even at the average closing prices.
So how significant is the weaker trend line for the Pinnacle dataset? Comparing the closing price returns for all steamers versus all drifters in the same way with a 2-sample 2-tailed t-test, the answer was fairly conclusive: not very significant at all. The p-value was 0.12. That is well outside even the weakest of statistical significance thresholds (0.05). [Although it's hardly a surprising result, for the record the difference between opening odds returns for steamers and drifters in the Pinnacle sample shows a p-value of 10 to the minus 200.]
So whilst there is still a weak inefficiency residing in the closing prices of this sample, it's not statistically significant and certainly not sufficient to make anyone a profit. This time the 48,693 prices which steamed by more than 10% lost 3.0%. Indeed, it is still -2% for the 13,361 odds which steamed more than 20%.
What might be the reasons for this different result. Well, one could argue that my original sample of 30,540 English match betting odds was too small and/or that it further demonstrates that we can't read too much into p-values even when they suggest strong statistical significance. I rather think that there is another explanation. Recall that my original analysis used market average prices. These averages are largely made up of soft bookmakers who will offer loss leading prices to attract new customers and to promote a message that they are competitive. As we know, exploit this repeatedly and you will be restricted unless you take measures to disguise yourself. The likelihood is that whilst a sharp bookmaker like Pinnacle will adjust prices regularly according to flow of money, soft books will more readily hold their prices. Consequently, even by closing there will remain considerably more inefficiency, with steamers not fully steamed and drifters not fully drifted. Of course with their generally bigger margins they can usually accommodate that risk, and use customer restrictions to manage anything else.
|